A number of changes to agricultural practices took place towards the end of the Anglo-Saxon period. The visible remnants of these changes are the ridges and furrows of the open fields. Ridges in the fields were created by repeatedly ploughing soil into the middle of a ridge. This also created a furrow between the ridges, and the furrows were about 15m apart, with a ridge between. Each strip of ridge and furrow was owned by a household.
There were usually two or three open fields and crops were rotated around the fields and the rotation also included a year when no crops were planted in one of the fields. The fields were managed co-operatively by the families that farmed them. Villages coalesced around the manor and the church.
The problem we have is that there is very little evidence for the date of these changes. David Stocker in his English Heritage book of the landscape of the East Midlands suggests a date of around 850 based upon the evidence of pottery finds in the open fields and modern villages. Fieldwalking of fields known to be open fields produced some dense scatters of pottery from before 850. These are believed to be the remains of farmsteads that had been moved to make way for the open fields. The open fields had a thin scatter of pottery post-850 these were generally small fragments believed to have come from domestic waste used to manure the fields. Where sites in modern villages have been excavated the amount of pottery increases after about 850.
These changes were revolutionary, having a big impact on the way that people farmed and the way that they interacted with each other. They happened at around the same time across a broad swathe of the country, stretching from Yorkshire down to Dorset, although large areas of the country (Wales, Devon and Cornwall, East Anglia) were unaffected. Despite the magnitude of the changes there is very little documentary evidence for their implementation or existence. Domesday Book contains a few hints that arable farming may have happened in this way but the lack of evidence in Domesday has convinced some that the open fields and ridge and furrow farming must have been introduced after the Norman conquest.
An example of the fragmentary nature of the evidence can be found in a charter of 999 concerning land in South Cerney in south Gloucestershire. After a dispute the king granted the estate of South Cerney to the widow, Eadflaed. The charter describes the boundary of the estate and these seem to agree with the boundary of the modern parish.
The interesting bit is right at the start of the description of the boundary in the north of the parish. In modern English it reads:
Start at Cat’s stone and follow a furrow on the family moor
0n the High Street follow the road to the moot ford
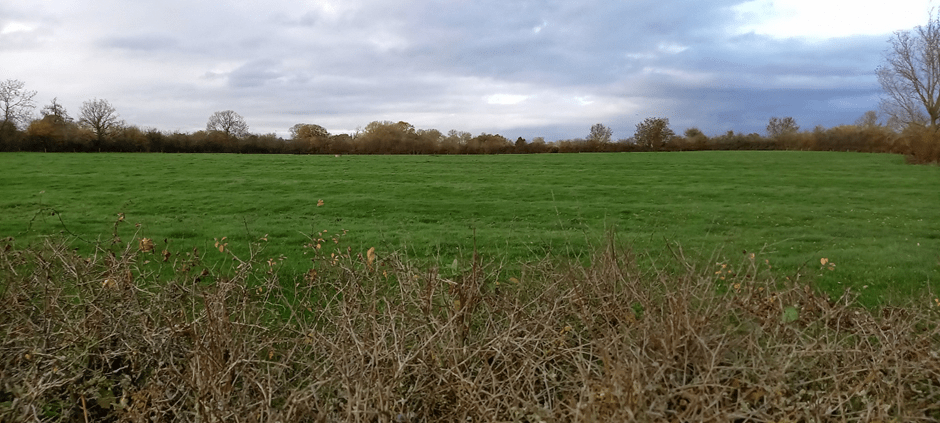
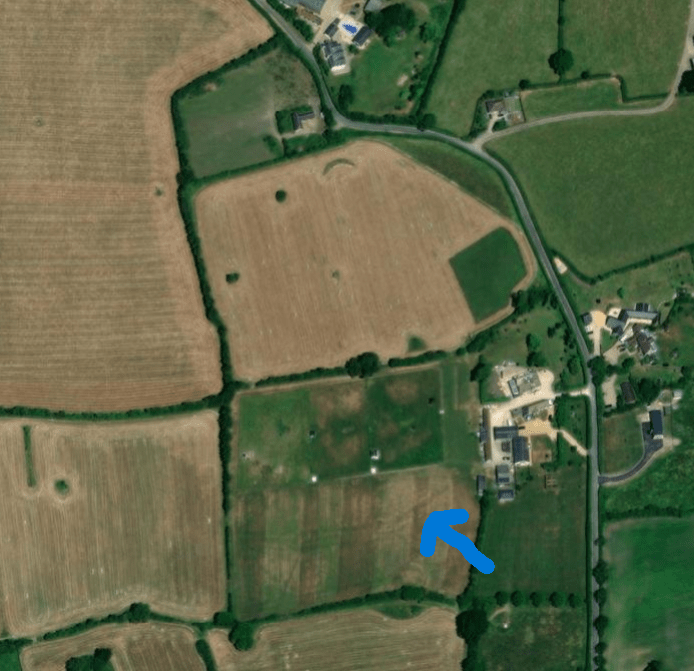
The High Street is Ermine Street which runs diagonally across the top right-hand corner of the image.
At the end of the description of the bounds the charter describes how the route follows the River Churn then back to the Cat’s stone, so the furrow mentioned lies between the River Churn and Ermine Street and lies on the Estate boundary which is also the parish boundary.
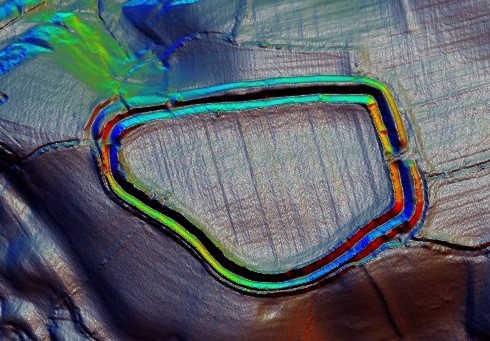
The furrow referred to is likely to be the ridge and furrow that can be seen on LIDAR. The furrows align with the parish boundary. (The parish boundary is shown in red and the field with the ridge and furrow is outlined in blue)
David Stocker’s date of 850 for the creation of the open fields came from studies in Leicestershire and Northamptonshire so may not be applicable in South Gloucestershire, but we now have evidence that ridge and furrow here preceded 999.
Notes
The translation of the charter of 999 comes from “Fertile Fields and Small Settlements – A History of South Cerney and Cerney Wick” by Michael Oakeshott
Lutudarum is a Roman place name listed in the Ravenna Cosmography. It is in a group of places in Cheshire and Derbyshire and is listed next to Derventio, believed to be the Roman fort of Little Chester, just north of Derby City Centre.
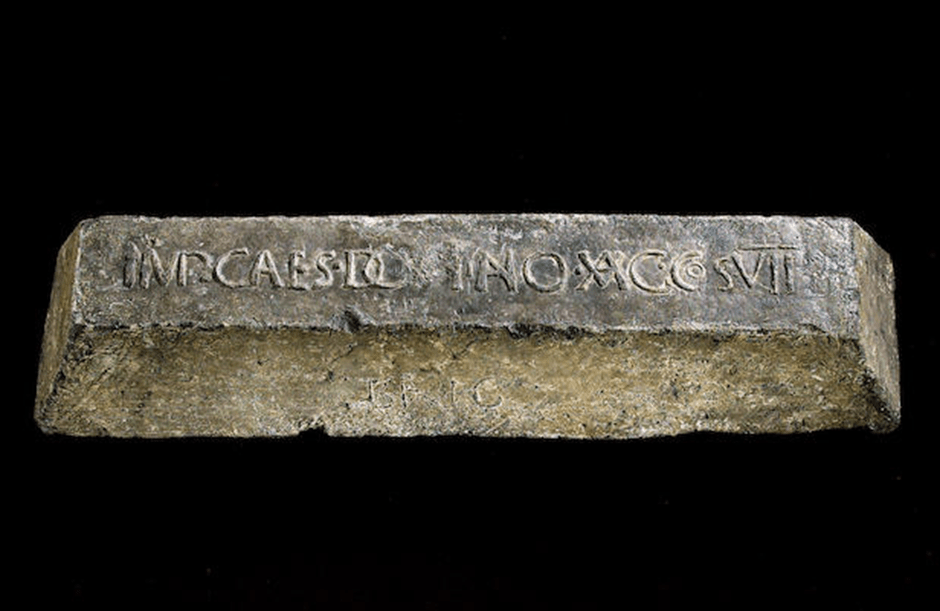
The Romans mined lead in Derbyshire and cast smelted lead into blocks known as pigs. These pigs of lead are known to be Roman because of the inscriptions in Latin. The inscriptions often include (in abbreviated form) the name of the emperor at the time of casting or the name of individuals trading the lead, and sometimes the abbreviation LVT. It is a reasonable assumption the LVT refers to Lutudarum and that this was a settlement or fort connected with lead mining. The location of Lutudarum has been the subject of much speculation and Chesterfield, Crich, Matlock, Cromford, Wirksworth and Carsington have all been proposed as possible locations. Harry Lane in his book ‘The Romans in Derbyshire’ reviewed the evidence for the various locations and also considered several known Romano British settlements. There is so much speculation because there is no evidence. Wirksworth was favoured by many as a possible location because of its later role as an administrative centre for lead mining but there is absolutely no evidence of a Roman settlement in Wirksworth.
Fig. 1 Roman Pig of Lead from Yorkshire
My objective in this blog is to map the distribution of the pigs of lead that can be attributed to a Derbyshire origin to see what we can deduce about the source and distribution of the lead. Pigs of lead from Derbyshire have been found as far north as the Humber estuary and as far south as Sussex.
Fig.2 The distribution of Derbyshire pigs of lead in Britain
There is an obvious concentration of pigs of lead in central Derbyshire
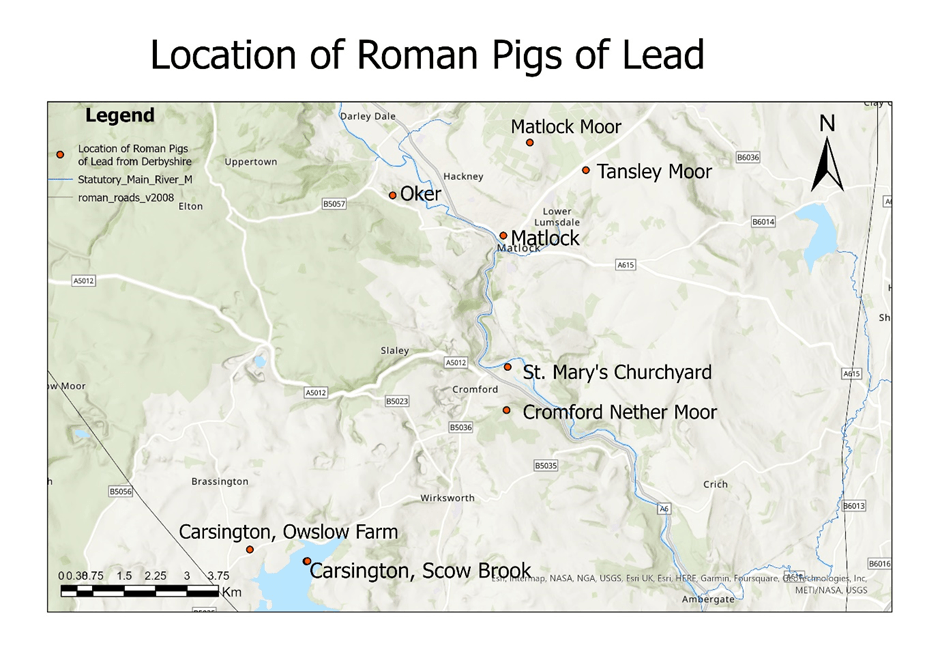
Fig.3 Roman Pigs of Lead in Derbyshire
Fig.4 Roman pigs of lead in Matlock/Cromford/Wirksworth area
The largest concentration of pigs of lead is in the Matlock/Cromford/Wirksworth area and there is a group of six pigs of lead that are not close to a known Roman road. Most of the other known pigs of lead are within a few miles of a known Roman road.
From the distribution of the pigs of lead it looks as if there several sources of lead and several smelting sites within a fairly small area. If there was one smelting site you would expect the pigs of lead to be concentrated in a particular area or along a particular route. So, if there were several extraction sites and several smelting sites. Lutudarum was not necessarily directly involved in the process. It may have just been an administrative site for this area.
Since all six of this group are not near known Roman roads but are close to the River Derwent this is the most likely route for transport out of the area. In his book, Lane argues that the Derwent was probably navigable by shallow-draughted boats in the Roman period. It looks as if some pigs of lead were transported all the way down the Derwent then down the Trent to Petuaria (Brough on Humber). Three of the pigs of lead from this area (Broomfleet, South Cave and Ellerker) were found in parishes along the north bank of the Humber Estuary between the outflow of the Trent and Petuaria suggesting that this was the route. Some have suggested that these pigs of lead were destined for export but it is more likely that they were heading for York which was being rebuilt in stone at the end of the first century and the start of the second century. The lead had been floated downstream via the Derwent and Trent but was too heavy to be transported upstream via the Ouse so was transferred to the Roman road from Petuaria to York. Other pigs of lead appear to have been distributed via the Roman road network and may have joined the road network at Derventio (Little Chester, Derby).
There have been several archaeological digs at Little Chester (Derventio) by York Archaeology. The most recent finished in August 2025 and raised questions about the status of the Roman occupation of the site. Although the excavated remains clearly show the classic playing card shape of a Roman fort there is very little archaeological evidence for a military presence and the archaeologists prefer to use the term “defended settlement” when talking about the site. The defences are quite close to the River Derwent so if Derventio had a role in controlling river traffic you would expect a harbour or wharves or maybe just a beach, but no evidence of this has yet been found. The only hint that this “harbour area” did have an important role is a defensive ditch on the north side. It is possible that Derventio was a distribution centre for Derbyshire lead, with lead being off-loaded from small vessels onto larger vessels for its journey downstream along the Trent, or the Roman roads running north and south along Ryknield Street and west along Long Lane.
What does this tell us about the location of Lutudarum?
If the majority of the lead mined in the late 1st or early 2nd century was coming from the Matlock/Cromford/Wirksworth area and was being transported out of the area down the Derwent, it would make no sense to have the administrative centre in Chesterfield or Crich. My guess (and it is only a guess) is that Lutudarum would be sited at a strategic location where the Romans could monitor lead production (eg making sure that the locals aren’t smelting their own lead for the black market) and also monitor the transport of lead out of the area. The best place to perform this latter task would be at Cromford; all the lead would come downstream to here and lead from Cromford Nether Moor would join the Derwent here.
There are two interesting sites in Cromford. Firstly there is the flat area of ground just below the Cromford Mills Car Park. Part of this area was where the Arkwright family built their family chapel, now St Mary’s church, and the other part is Smelting Mill Green, known to have a lead smelter here in 1575. This area would be large enough to accommodate a small Roman fort and is ideally placed to monitor traffic on the Derwent.
Fig.5 St. Mary’s Church, Cromford
Fig.6 Information Board for Smelting Mill Green
The 1899 large scale Ordnance Survey map of the area shows a v-shaped cutting that gave access from the area to the River Derwent but without archaeological investigation it is impossible to date the feature. However it does suggest that the river could have been used as a means of transport out of the area.
Fig.7 1899 Ordnance Survey map of Smelting Mill Green
The other site of interest in Cromford is St. Mark’s churchyard. The church itself has been demolished but the graveyard is still in use. This church preceded St. Mary’s as the parish church and some locals think that the pigs of lead found near St. Mary’s may actually have been found at St. Mark’s. The interesting thing about the churchyard is that it is an almost perfect rectangle about 100m by 60m. Almost Roman fort shaped!
Unfortunately there is very little archaeological evidence that supports any particular location. There is a scattering of Roman finds from the Matlock/Cromford/Wirksworth area but nothing that would suggest a Roman settlement.
What about Carsington?
The Roman Roads map was published in 2008 and is now out of date. On the map the road from Buxton to Little Chester was conjectural after Longcliffe, but Dave Ratledge’s LIDAR analysis has shown that the road runs very close to the Scow Brook site (now under Carsington Reservoir). The problem I have with Carsington is the dating evidence. The pigs of lead that mention LUT (Lutudarum) are late 1st or early 2nd century but the Scow Brook site seems to be later than this. It has been badly damaged by ploughing and was difficult to date and there was very limited evidence for occupation before 150. The pigs of lead from this area are 3rd or 4th century from their context. There could be other sites in the vicinity that did exist in the early part of the occupation of Derbyshire but there is no reason to favour Carsington over other sites.
Other Romano-British sites in the area eg Rainster Rocks are also from a later phase of lead extraction.
In summary there is no archaeological evidence for a Roman settlement in the Matlock/Cromford/Wirksworth area of Derbyshire from the early part of the conquest. My favoured location for the site of Lutudarum is Cromford but we need some archaeology. I think I shall try Time Team!
References
Lane, H. (1986) The Romans in Derbyshire, Lead Mining and the Search for Lutudarum. Veritas Publications (Derbyshire), Bolsover
Ratledge, D. (2021) Derbyshire Archaeological Journal 141 7-31
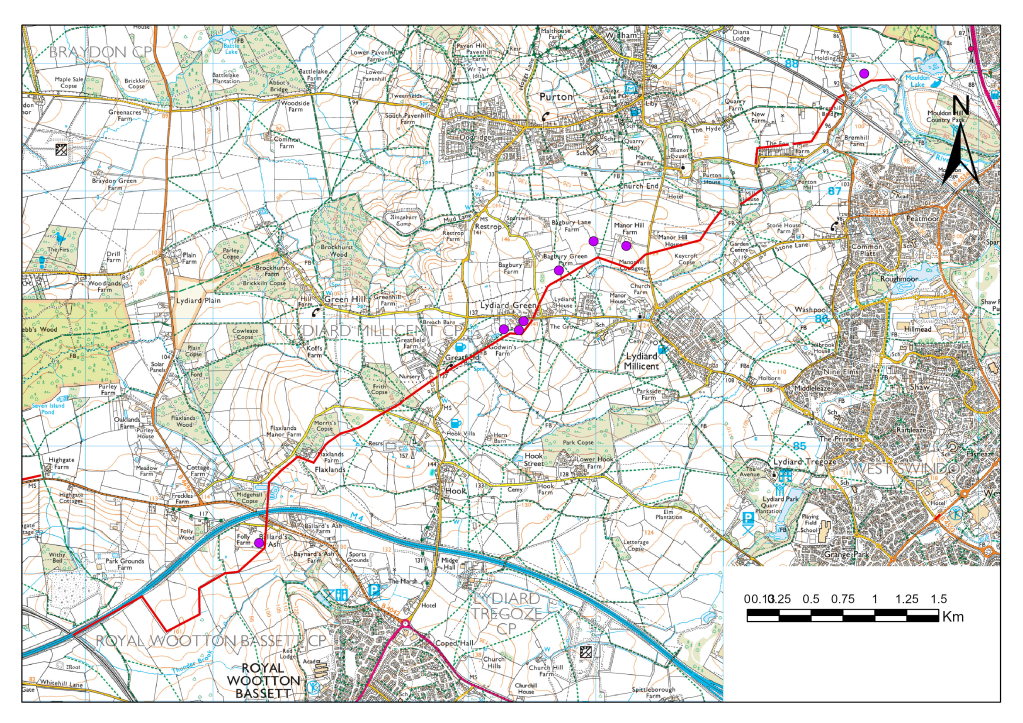
In May 1940 Germany invaded France. British troops in France retreated to the channel coast and most of the British Army was evacuated from Dunkirk but left most of their equipment behind. France quickly surrendered and there was a real danger that Britain would be the next target for invasion. General Ironside was given the responsibility of organising Britain’s defences. The first line of defence was along the coast but further inland a series of stop lines was envisaged that could halt the German advance if they broke through the coastal defences. These stop lines consisted of natural barriers and constructed defences. One stop line ran along the Thames upstream from London and along the Avon upstream from Bristol. Unfortunately, there is a gap between the two rivers and this gap was plugged by a defensive line (GHQ stop line red) running from Great Somerford on the Avon to Lechlade on the Thames, then further on to Tilehurst near Reading. Part of this gap was defended by an anti-tank ditch and pillboxes. The anti-tank ditch ran from just north of Wootton Bassett to the River Ray at Mouldon Hill in Swindon. Additional defensive support was provided by seven pillboxes along the route with an additional pillbox situated just north of Blunsden station.
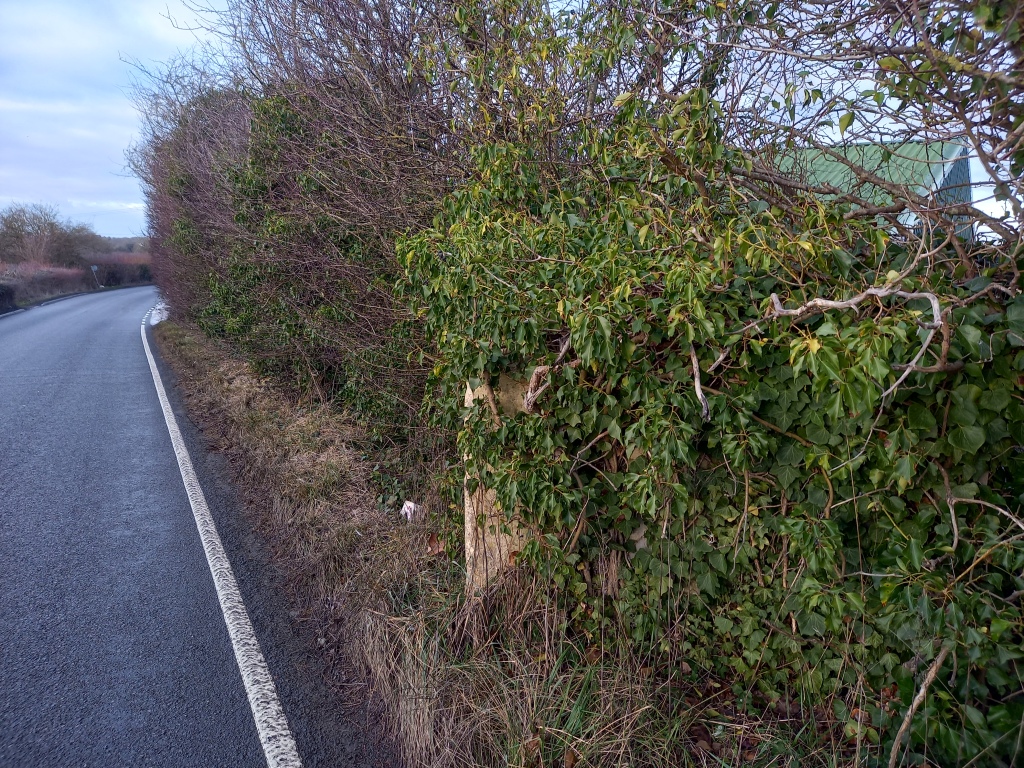
Fig 1 Pillbox, north of Lydiard Millicent, west of Manor Hill Farm
Fortunately, the defensive line was never tested and after the war the ditch was filled in. Of course, the material from the ditch didn’t go back in completely and there was a hump where the ditch had been. Most landowners waited for the hump to settle but some spread the hump out to make the ground flat. The hump can still be seen in many places along the route but in some places the line of the ditch is marked by a slight dip where the hump was bulldozed and settling occurred afterwards. Pillboxes had been constructed to withstand direct hits from tanks so were extremely difficult to demolish, so most were simply left alone.
The route has been studied before and around 2000 two complementary articles were published, one in the Lydiard 2000 magazine by Michael Saunders and one in the Purton Historical Society by Eric Tull. The article by Eric Tull had a map of the route. I wanted to see if there are still any visible remains of the ditch today (2023). Before starting out in the field I examined LIDAR images of the area. LIDAR provides an accurate image of the ground surface by surveying from a light aeroplane. The big advantage of LIDAR is that an image can be produced of the ground surface without vegetation so that it often reveals features that are not visible to the naked eye. LIDAR images are readily available from lidarfinder.com but I used images that used DEFRA data downloaded to ArcGIS. DEFRA is a government agency that originally used LIDAR data to assess flood risks but is now available for most of the country. ArcGIS is a software package for processing and displaying geographical information.
Some sections of the ditch show very clearly on LIDAR
Fig 2 In this LIDAR image the ditch starts in the bottom left hand corner and heads north-east, crossing the Flaxlands road, going through the stable yard before skirting Frith’s copse.
From the LIDAR images I was able to construct these maps of the route:
Fig 3 Route of the ditch from LIDAR images (Southern section)
Figs 4 Route of the ditch seen by LIDAR (Northern section)
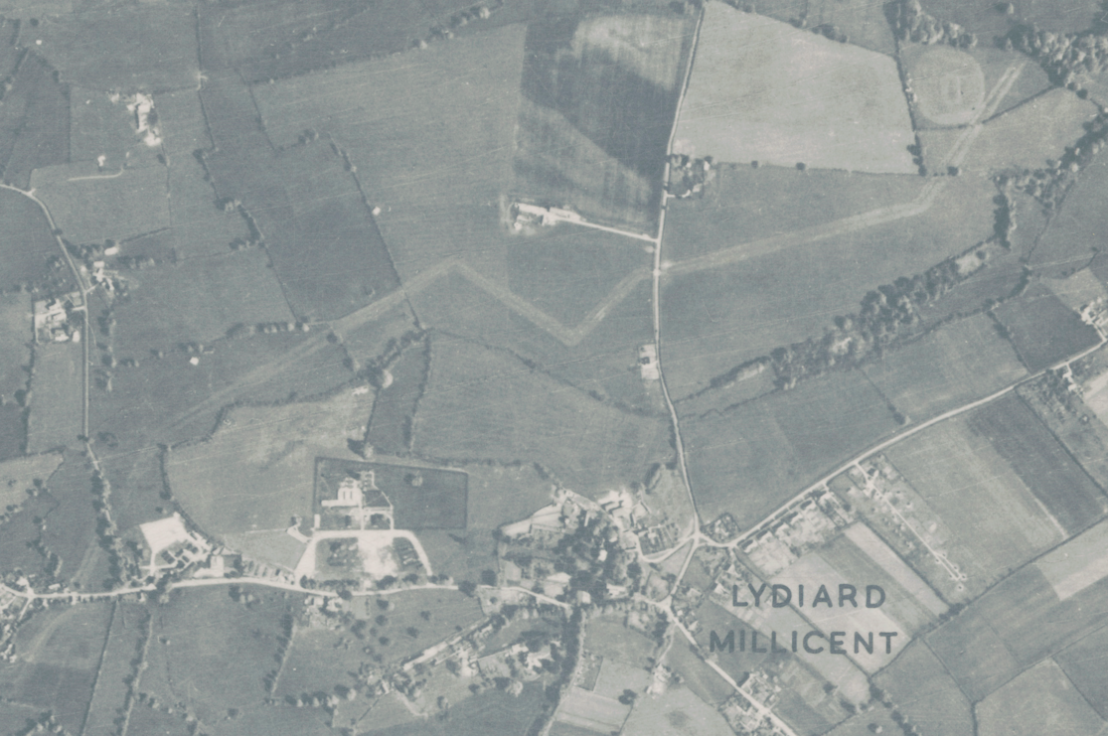
However, there were some areas where the route of the ditch wasn’t clear. But another source of data has recently become readily available. The National Library of Scotland publish several different versions of Ordnance Survey maps on their website, maps.nls.uk , not just for Scotland but for the whole of the UK. Recently that have also published aerial photographs, joined together to form a continuous picture. Currently they cover mainly the south east of England. The aerial photographs were mainly taken just after WW2 when the RAF had surplus planes and surplus pilots. For the area we are interested in the photographs appear to have been taken after the ditch was filled in but it is still very visible.
Fig 5. Aerial photograph from the post-war period. The ditch showing in the area north of Lydiard Millicent. Pillboxes show as white spots. In the top right hand corner the ditch touches the edge of the cricket ground
The aerial photographs can now be used to complete the map of the route of the ditch.
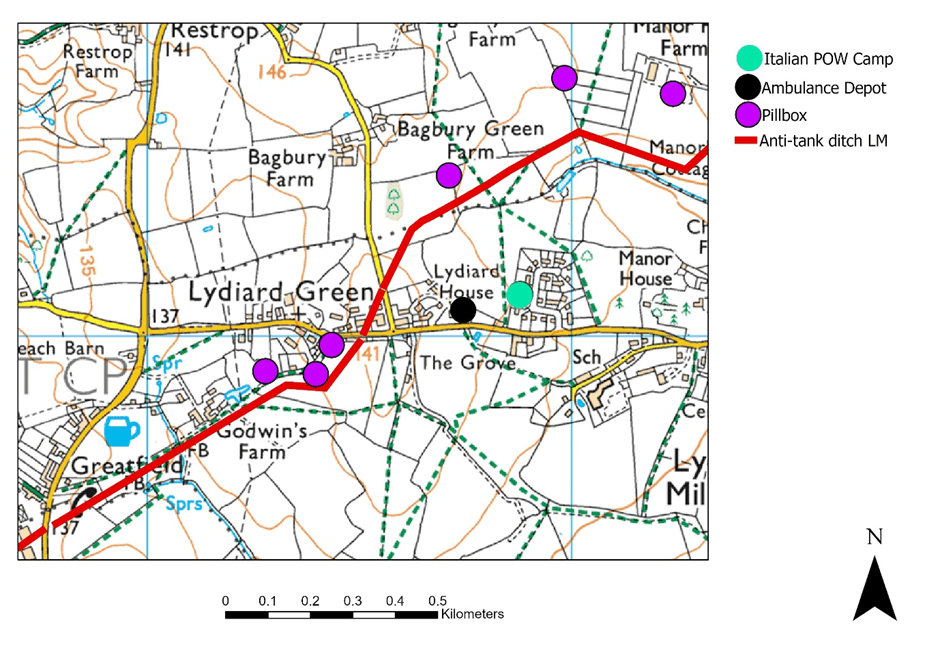
Fig 6 Route of the Ditch (Red line) and position of pillboxes (Purple dots)
Update Oct 2023. Since I first published this blog more aerial photographs have been made available on the Historic England website and those taken by the USAF in 1943 have shown that, at the south west end of the ditch it continued to the railway line to about the same place as the M4 crosses it now. The M4 building work obliterated the last section of the ditch. The complete picture now looks like this:
So what can we see today? Obviously, the pillboxes are the most visible remains but there also remains where the ditch crossed a road. Rather than dig up the road, a roadblock was created using concrete blocks and after the war these blocks were simply pushed to the side of the road, where amazingly many still remain. These are near The Fox:
Fig 7 Concrete blocks used as anti-tank measures
And there are four on the ramp leading up to Bremhill Bridge:
Fig 8 One of the concrete blocks used as a roadblock on the approach to Bremhill Bridge
But, what of the ditch itself? This photograph was taken from Flaxlands Lane looking south and the hump of the ditch can be clearly seen in the foreground.
Fig 9. The hump of the filled in ditch near Flaxlands Lane
Other places where the hump can be clearly seen are at the bottom of Flaxlands Lane in the field below Flaxlands Farm where the line of the ditch runs parallel to the road, and in Mill House field between Stone Lane and Purton where the line of the ditch runs diagonally across the field.
The archaeological remains of GHQ Stop Line Red are an important reminder of the impact of WW2 on a quiet corner of North Wiltshire. There are other reminders and these will be explored in future Blog posts.
Keith Allsop March 2023
Further Reading:
Wills, H (1985) Pillboxes, A Study of UK Defences 1940. Leo Cooper/ Secker and Warburg, London
Additional Information about the Pillboxes and other sites in Lydiard Millicent.
In June 1940 there was a real danger Britain would be invaded by Nazi Germany. France had fallen and while most of the British army had escaped via Dunkirk they had left their armour behind so Britain was vulnerable. Defences had to be constructed – and quickly.
The first line of defence was along the coast but if these defences were breached there were several stop lines further inland. One of these stop lines was GHQ stop line red which was designed to protect the industrial Midlands from an invasion on the south coast. The stop lines used natural barriers where possible and it was thought that the Thames would provide a barrier as far west as Reading, and the Avon would provide a barrier as far east as Great Somerford. The gap in the middle was closed by GHQ stop line red. This is the line that runs through Lydiard Millicent and in this area it consisted of an anti-tank ditch and pillboxes. The red line is the route of the anti-tank ditch and the purple dots are the pillboxes.
But Lydiard Millicent was impacted by the war in other ways. An ambulance depot was stationed at Lydiard House (The house in Lydiard Green not Lydiard House in Lydiard Park) and they picked up wounded forces personnel from the airfield at Down Ampney and transported them to the American hospital at Lydiard Park and other specialist hospitals further afield. In 1944 the American hospital became a hospital for German POWs, then after the war was used as temporary accommodation and at least one local resident was born there. Not far from the ambulance depot there was an Italian POW camp on the land that is now The Beeches and if you walk the footpath to the west of the Beeches you can still see the concrete bases of the huts that housed the prisoners.
The anti-tank ditch was filled in after the war so is difficult to see in this area but the pillboxes survive. They were built to withstand a direct hit from a tank shell so are difficult to demolish. There are two types on the Green; the one nearest the road would be manned by soldiers with Bren guns but the other two would also have a two pound anti-tank gun aiming towards German tanks coming from the south and south east.
The pillbox nearest the road is a type 22 which is a regular hexagon which would be manned by five soldiers with light machine guns (usually Bren guns). The entrance is at the rear, facing the road but this has now been blocked up.
The two pillboxes not visible from the road are type 28, designed to house a two pound anti-tank gun. This would be wheeled into position through the back of the pillbox with the barrel pointing towards the anti-tank ditch. Soldiers with bren guns would be able to fire at oncoming troops through the three smaller embrasures.
I have had a ground source heat pump for the last 15 years. In 2019 we had an extension built and added an air source heat pump to the system. This article is an objective view of the pros and cons of heat pumps from somebody with practical experience.
Heat pumps are supposed to be an efficient, renewable energy source. Is this true? They are expensive and take up much more space than, say, a gas combi boiler. Since 2021 new installations of heat pumps have been eligible for a grant of £5,000. Prior to this those who installed a heat pump in their home received a quarterly payment as they used the system; this payment was called the Renewable Heat incentive.
One of the most obvious disadvantages of a heat pump is the amount of space they take up. If you use a heat pump for room heating and hot water you need two tanks – one for the hot water and one for room heating. Add in the heat pump itself and it becomes impractical to house this inside most modern houses. The installation pictured is for a large four bedroomed house so would be smaller for a smaller house but still difficult to fit in. Most installations are therefore moved out to the garage. We now have two elements that combine to reduce the efficiency of the system.
Ground Source heat pumps are supposed to generate 4kW of output for every kW of energy input. For air source heat pumps this ratio is slightly less at 3:1. But as the water is stored it loses heat. As the water is transferred from the heat pump around the house it loses more heat. And since the heat pump is often situated away from the core of the house it is usually necessary to circulate the water around the house so that hot water arrives at the tap, but constantly circulating the water loses even more heat. I estimate that the true efficiency of the total system, including ground source heat pump, is around 1.75:1 and the air source heat pump around 1.5:1.
One of the features of a heat pump is that it does not heat the water as hot as a traditional gas boiler. For hot water heating a gas boiler is usually set to around 60°C. A heat pump is usually set to 50°C. The hotter you want the water the less efficient the heat pump becomes. The factory settings for my heat pump had a set temperature of 50° with a temperature drop of 10°. So, the heat pump heated the water to 50° then switched off. The water temperature would drop to 40° before the heat pump kicked in again. If you are unlucky when you run your bath the water is just above 40°. So, if you like a hot bath – tough. To help maintain a higher temperature I have changed the set points so that the set temp is now 51° and it drops to 43°before heating up again. These changes will have reduced the efficiency of the heat pump but make the water temperature a bit more acceptable.
The water for room heating is also lower. With underfloor heating the set temperature is usually around 35 – 40°. This usually varies with outside temperature. If it gets colder outside the set point increases so the water going through the underfloor heating is hotter. If the underfloor heating is running all the time and the room isn’t warm enough it is possible to increase the temperature of the water going to the underfloor heating. The trouble is, the higher the temperature, the less efficient it becomes. Underfloor heating is good for solid floors but not so good for suspended floors so the usual recommendation for upstairs rooms is low temperature radiators. These are larger than normal radiators and, like underfloor heating, are best left on a low temperature all the time. But this is very wasteful for bedrooms. Bedrooms are unoccupied most of the day and during the night you are snuggled up under a quilt so you only need heating for a short time in the evening and a short time in the morning. The best solution for this requirement is a traditional gas combi boiler with normal size radiators. If you don’t have gas, a short burst from an electric heater is better than having your heat pump, underfloor heating or upstairs radiators running all day.
The good thing about underfloor heating is that (sorry for stating the obvious) you don’t have any radiators so this gives more freedom when designing your rooms. Unfortunately, underfloor heating isn’t reactive. It gives a low heat all the time but can’t give heat quickly. So, if you were out at work all day you couldn’t come home and switch on the underfloor heating and expect it to warm up quickly; you would reach temperature in time for the ten o’clock news. However, the underfloor heating/heat pump system is ideal for homes where the house is occupied most of the time, eg for elderly people.
If you think that a heat pump is the system for you, I would make the following recommendations:
Install in new builds only
Design so that the heat water is produced near the kitchen and bathrooms (to reduce heat losses in transfer)
Insulate all hot water pipes
The advice given by heat pump installers is to insulate the home properly before installation – make sure loft insulation is adequate, windows are double glazed and draught free, cavity wall is insulated. All this is true but it then makes it impossible to evaluate the impact of the heat pump. The suspicion is that most of the savings come from the improved insulation.
After you have done all that, you then have a problem with ventilation and condensation may become a problem. Extractor fans in kitchen and bathrooms are necessary but suck warm air out of the house so a heat recovery system should be considered. The problem is that these are very expensive and the payback time is about a hundred years. My solution to the excess moisture in the air is to run a dehumidifier, but then, of course, you are increasing your electricity usage and any savings are soon wiped out.
Finally, what about service and repairs? The number of heating engineers qualified to install and maintain and repair heat pumps is quite small and you don’t have much choice in your local area. If you have a heating engineer nearby they often only have one employee who specialises in maintaining and repairing heat pumps so if he is on holiday – tough. Your recourse then is to call out the manufacturers. The Worcester Bosch call out fee is over £400!
On a more positive note heat pumps don’t need much routine maintenance. They are not dangerous so no matter how badly you treat them you are not going to die of carbon monoxide poisoning. The only danger is that you will die of shock when you see your bills.
Ringsbury Camp is an Iron Age hillfort near Purton in Wiltshire. As far as I am aware it has never been excavated or surveyed, so we know very little about it. However, it is well preserved, and features not visible to the naked eye are visible on LIDAR images. It sits on a bed of Corallian limestone and this can be seen at the entrance in the south eastern corner of the hillfort.
The hillfort (red dot on the map) is easily accessed by a short walk from Purton. There is a footpath that skirts the southern perimeter of the hillfort, but there is no public access to the rest of the monument.
Hillforts come in all shapes and sizes and it is unlikely that all hillforts had the same function. One proposed function of hillforts is that they were concerned with the management of animals. Most hillforts were built in the period 800 – 400 BC and this period coincided with a climatic downturn with prolonged periods of colder and wetter weather, and hillforts could have been built to protect sheep from winter storms (see Climate Change and the Iron Age on this website, https://before1066.com/climate-change-and-the-iron-age/). There is evidence from the LIDAR image that Ringsbury Camp had other roles to play in the management of sheep.
To the north of the hillfort are two annexes; annexes are a common feature of Iron Age hillforts and are generally believed to be connected with stock management. There is access to each annex from the hillfort ditch via a gap in the outer bank. At these points of access, the ditch is frequently waterlogged.
Also on the LIDAR image near the north west entrance is an additional bank and ditch that extends from the western entrance to the first annex.
On the south side of the hillfort the public footpath runs along the top of the outer bank and has worn a groove in the bank.
Where the Mud Lane footpath joins the fort there is an accumulation of loose stone.
My (very rough) diagram shows the features a little more clearly.
My hypothesis is that sheep approached the hillfort from the east along Mud Lane. Where Mud Lane joins the hillfort the accumulation of loose stone indicates that the bank of the hillfort may have been faced with stone and this has collapsed thanks to the action of tree roots. The sheep went up the incline to the top of the outer bank and followed the footpath around to the western entrance. The action of the sheep has worn a groove in the top of the bank.
When the sheep got to the western entrance the sheep were sorted. Some went into the waterlogged section of ditch which could have been a sheep-wash. Some went through the sheep-wash and exited into the first annex and some exited into the second annex. There is also a route around to the first annex that avoids the sheep-wash. So why were they being sorted? There several possibilities:
Sorting the sick from the healthy
Sorting pregnant from the non-pregnant
Sorting by owner; if the sheep were marked in some way the flock could have sheep from several owners
Sorting by the quality of the wool; castrated rams produced the best wool
I am sure there are other reasons why the sheep would have been inspected and sorted, but it does seem that the sorting process is a good explanation for the observed landscape features.
A different LIDAR image , supplied by Phil Barrett, shoes some additional features not evident in the image above.
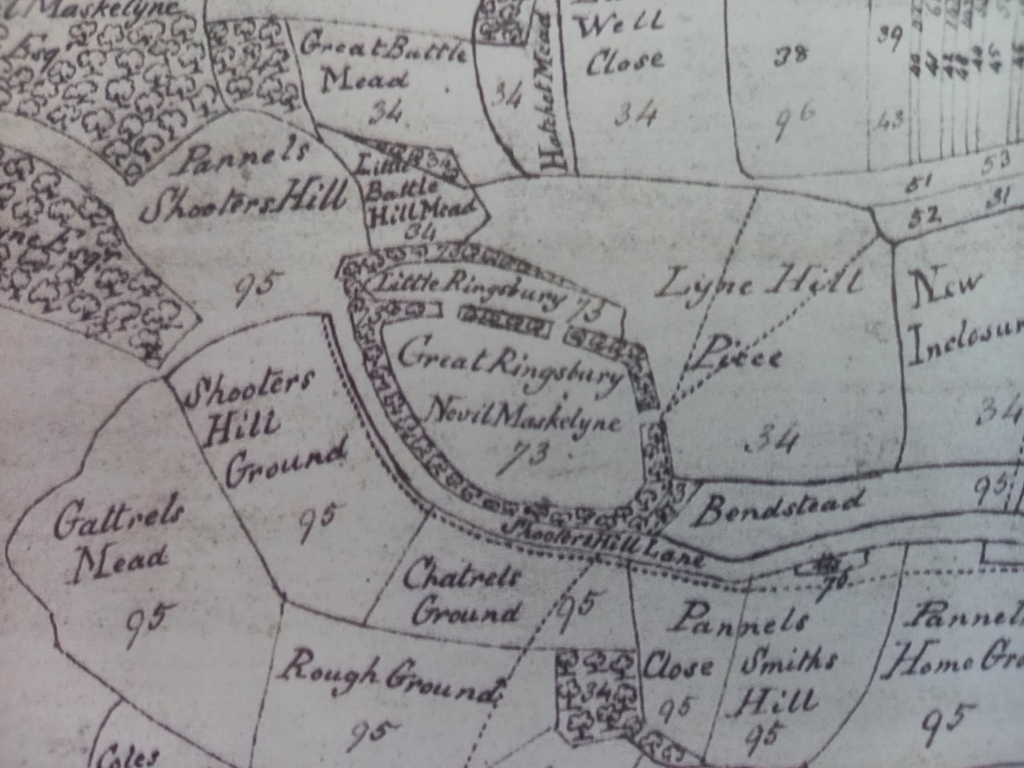
The larger, second annex appears to have a route around the hillfort to the eastern entrance. So, animals sorted into this annex could return safely to the interior of the fort. The theory that the enclosures on the north side are indeed annexes is confirmed by the 1744 Enclosure Map of Purton (a copy of which can be seen in Purton Museum).
This map clearly shows Great Ringsbury and Little Ringsbury with two entrances between them, so confirming the structure proposed from the LIDAR images.
There is other evidence that Ringsbury Camp is concerned with the management of sheep. The sheep probably spent time away from the hillfort and were brought to it for the processes described above. One possible location would be Purton Common. The road leading from Purton Common towards Ringsbury Camp is known as Hogg’s Lane. Today a hog is usually a word used for a pig but it is also a word for a one-year old sheep, Hogg’s Lane could be the route taken when the young sheep were being moved to the hillfort.
For more about climate change and the Iron Age go to https://before1066.com/climate-change-and-the-iron-age/ . This was my dissertation for the MSc in Applied Landscape Archaeology at Oxford Continuing Education Department.
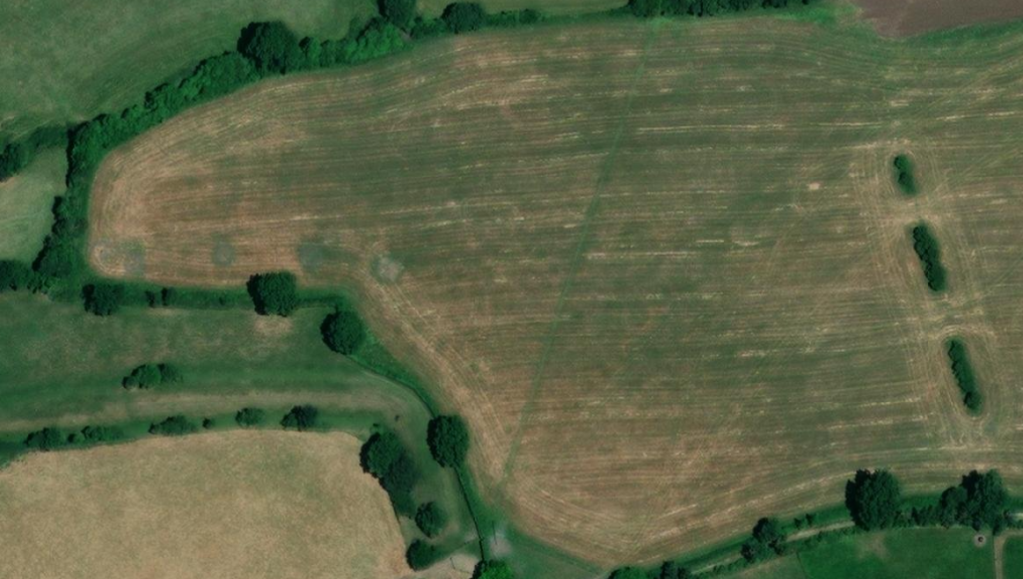
I have recently (Nov 2023) identified additional features outside the hillfort although these marks could be made by circular cattle feeders that were moved about the fields.
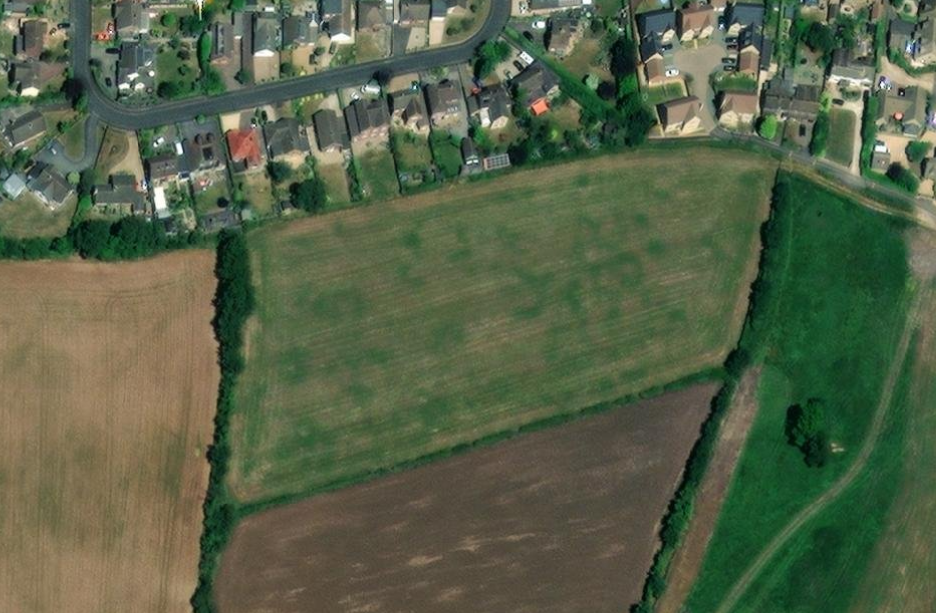
To the north of the annex there are several circles clearly visible in green against a parched background, indicating the presence of the ditches which are a feature of Iron Age huts. The rest of the field and an adjacent field also show the possible presence of features but they aren’t quite as clear cut.
However these crop marks can also be created by agricultural activity and circular animal feeders could produce similar markings in aerial photographs. The site seems worthy of a geophysical survey.
Is there another one just like the other one?
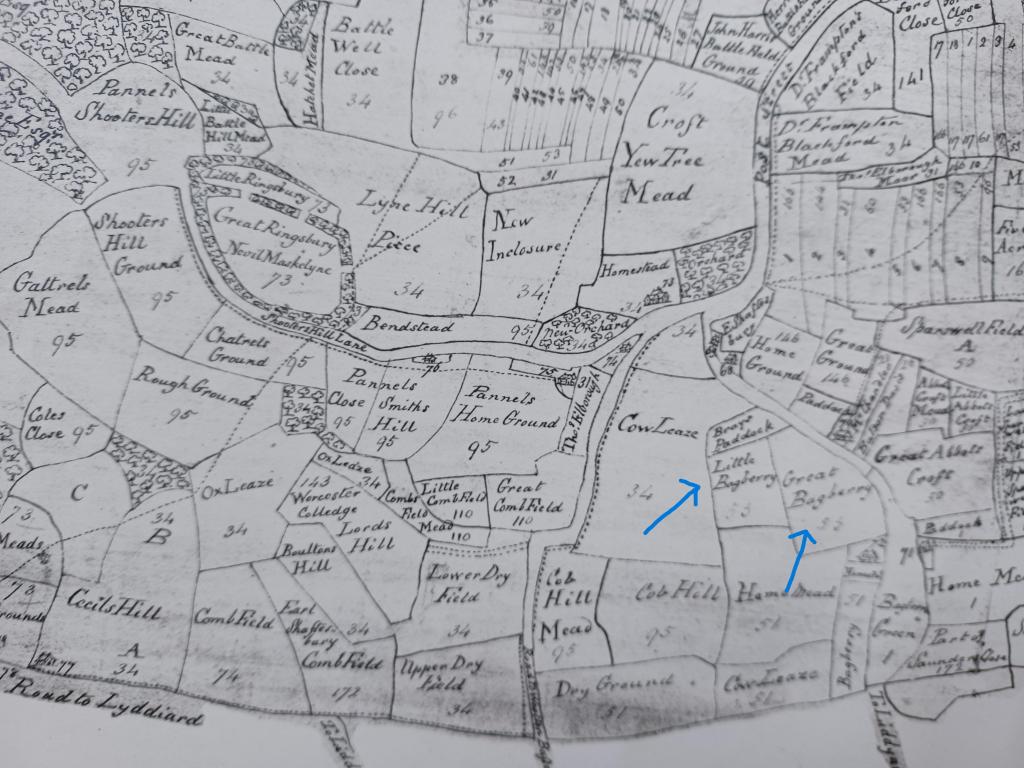
Less than 1km to the west of Ringsbury Camp is Bagbury Farm , adjacent to Bagbury Lane. There is some evidence that another hillfort may be hiding in this area. The obvious clue is in the name; the suffix -bury means fortified place and is shared by many hillforts. The next clue comes from the route taken by Bagbury Lane. The lane curves around before shooting off at a right angle. It could be curving around the remains of a hillfort that are no longer visible. The third clue comes from the 1744 enclosure map of Purton. As seen above the map shows Ringsbury Camp complete with its annexes and is divided into Great Ringsbury and Little Ringsbury. On the 1744 map there are also two adjacent fields known as Great Bagbury and Little Bagbury, so this could indicate that there was once a hillfort with annexes in this area. And finally there is LIDAR and aerial photography which appears to show a curved ditch along what would be the southern edge of a hillfort slightly larger than Ringsbury Camp.
A copy of The 1744 Purton Enclosure Map is on display in Purton Museum but if you need more information on this map you may contact me using the website contact details
There is no doubt that Repton was an important place to the Mercians and was also the site where the Viking Great Army overwintered in 873-874. Repton is frequently mentioned as a place where Mercian kings granted charters and the churchyard at Repton contains several graves that are distinctively Scandinavian.
The site around the Church was excavated by the Biddles between 1974 and 1980. Their conclusion was that the church was part of a defensive D shaped enclosure that had housed the Great Army. A nearby mausoleum was excavated and found to contain the bones of at least 264 individuals and the Biddles postulated that these individuals were part of the Great Army. However, the initial radiocarbon dates did not support this with some individuals appearing to have died in the 8th century. Cat Jarman looked at the bones again and concluded that many of the individuals had consumed a mostly marine diet and this had distorted the radiocarbon dates (the marine reservoir effect). When she corrected the radiocarbon dates for this effect all the individuals now had a date of death that was compatible with death around 873/874.
The D shaped enclosure
In their recent book ‘The Viking Great Army and the Making of England’, Julian Richards and Dawn Hadley (2021) question some of the conclusions about the D-shaped enclosure. The archaeology is complicated by the presence of ditches belonging to the bailey of the 12th century castle and Richards and Hadley believe it is possible that the archaeology may have been misinterpreted. To clarify this the excavation archive would need to be studied. It is possible that there never was a D shaped enclosure.
Did those buried in the mausoleum really have a marine diet?
The Great Army had been in England since 865. Their known overwintering sites were not near the sea and there is no evidence that they brought in vast quantities of fish for the 5000 or so members of the Great Army to eat. They appear to have lived off the tribute brought to them or foraged for in the local area. However, according to Cat Jarman, the isotopic evidence is that many of those buried in the mausoleum did have a diet with a significant marine food content. This is based upon C13 content of bone collagen which turns over about every 10-15 years. After 8 years in England there wouldn’t be much evidence left of a marine diet and this is the result obtained from samples sent to the University of Utrecht. The results from five samples indicated a marine food content of around 10%. A larger number of samples were analysed by the Oxford Radiocarbon Accelerator Unit but the same five samples indicated a marine food content of between 15 and 28%. The authors felt that the Utrecht figures were less reliable than those from Oxford, and only used the Oxford C13 results to calculate percentage marine diet content and revised radiocarbon dates that took into account the marine reservoir effect. A number of assumptions were made in the calculation and these had a significant impact on the precision of the results.
The revised radiocarbon dates were impacted in two ways. The dates became less old and the dates became less precise. Take sample G529 for example. The original radiocarbon date was 670-770. Taking into account marine reservoir effect the dates become 690 to 939. The range of possible dates has changed from 100 years to 249 years so almost any measurements will now include the 873/874 dates. Simply by including the marine reservoir effect in the calculation, the hypothesis that all the bones relate to the overwintering of the Great Army is now possible. This is very poor use of science.
So, in summary, the evidence for a D shaped enclosure is not convincing and the evidence that all the people buried in the mausoleum belonged to the Great Army is also a bit shaky.
Madgwick et al (2019) used strontium (Sr), oxygen (O) and sulphur (S) isotopes to determine how far pigs had been transported before being consumed at Neolithic sites in Wessex. Strontium is the most reliable indicator of geographical location and depends upon underlying geology. Strontium is incorporated into tooth enamel in young animals and is then fixed for the rest of the animal’s life. The strontium isotope values of a few pigs from some sites showed that they were raised in areas of older rocks (not the chalk found in Wessex). The Sr isotope ratio of bioavailable strontium on the Wessex chalkland is around 0.708, but some pigs had a Sr isotope ratio much higher than this, up to 0.717. There are older rocks in the south of Britain; the Silurian rocks of south wales and the pre-Cambrian rocks of the Malvern Hills have a high ratio, but rocks with a Sr isotope ratio as high as 0.717 are only found in the north of Britain, in the Lake District or some areas of Scotland. This led Madgwick et al to suggest that animals may have been brought from Scotland to Durrington Walls.
In another paper published around the same time, the same group (Evans et al 2019) studied Sr ratios in cattle. They had concluded that some cattle may have been transported from Scotland, but they also raised the possibility that there could be sources of high strontium isotope ratios in the south of Britain that were so far undiscovered. This possibility was raised because other papers had found high strontium isotope ratios in animals and humans that were very unlikely to have been raised in Scotland. However this suggestion was not included in the paper on pigs.
One of the problems with the suggestions that animals were moved around 400 miles before being consumed is the impracticality. It is conceivable that cattle could have been driven along drove roads to get from Scotland to Wessex, but this would have been a journey of several weeks. The return journey would take the total journey into months. Pigs are even more difficult to transport. Pigs cannot be herded like cattle or sheep so driving pigs all that way is highly improbable. Live animals could have been transported by sea but that would be an extremely arduous coastal route that would still involve land transport at each end of the journey. The only other possibility for the transport of live animals is that they were moved by cart. (Is there any evidence for wheeled vehicles in the neolithic?) If they weren’t transported as live animals were they butchered in Scotland and the meat carried to Wessex? Again, unlikely. If the pig had been butchered in Scotland would they really have carried the head all the way to Wessex?
Madgewick et al have been criticised for publicising an unlikely conclusion. Barclay and Brophy (2020), pointed out that strontium isotope ratios up to 0.716 have been found in the Malverns and several places in Wales. Only two pigs out of 131 had ratios above this with a maximum of 0.7172.
Madgwick et al responded by emphasising that their study was a multi isotope study and the results from oxygen and sulphur isotope values support their claim that the pigs could have originated from Scotland. I am not convinced. Oxygen isotope values from pigs are difficult to relate to oxygen isotope values of groundwater and they do not attempt to do this, so cannot identify possible origins of individual pigs. All they can say is that there is a variety of values that must reflect a variety of sources. My biggest problem with this is that pigs are omnivores. They eat anything that is available and if they are fed food waste, how the food has been processed will affect the oxygen isotope values.
Similarly sulphur isotope values cannot be related to specific locations. Generally values are related to the proximity of the sea but the resolution is poor and there is no map that relates sulphur isotope values to location. Again, the authors say that the wide variety of values reflects a variety of origins for the pigs.
Conclusions
To quote directly from Madgwick et al (2019):
On the basis of current mapping data, it is not possible to define origins with confidence, even when using multi-isotope proxies.
Unfortunately, in their abstract they are not quite so cautious and talk about transport pigs “over vast distances”. In their conclusion, based on strontium isotopes, they say that “some of the pigs are likely to derive from Scotland.” I think it is fair to say that their mixed messaging invites criticism.
Overall, the transporting of pigs from Scotland is a very unlikely scenario. There is no doubt that the animals consumed at Stonehenge came from a variety of sources but they most likely came from different sources across southern Britain.
Evans, J., Parker Pearson, M., Madgwick, R., Sloane, H. and Albarella, U. (2019) Strontium and oxygen isotope evidence for the origin and movement of cattle at Late Neolithic Durrington Walls, UK. Archaeological and Anthropological Sciences 11:5181-5197
Recently a more accurate strontium isotope map of south west England has been published, https://the-past.com/news/redrawing-the-strontium-isotope-map-for-the-south-west/ This demonstrates that there are areas in the south west that have higher strontium isotope ratios and that the cattle and pigs found in the Stonehenge area probably came from local sources, not from Scotland, vindicating the above post.
Several typos in the fist few pages made me take an instant dislike to this book. If you are going to write a book on history you have to be accurate. As well as the typographical errors there are other simple errors. For example when she talks about the end of Alfred’s reign she says that the Anglo-Saxon Chronicle is quiet on the closing years of the tenth century. Unfortunately Alfred died at the end of the ninth century. The book was clearly an attempt to capitalise on the 1100th anniversary of Aethelflaed’s death. As the deadline loomed there was no time for proof reading.
The only new material in this book is the unfounded speculation so if you must read a book on Aethelflaed read ‘Aethelflaed, The Lady of the Mercians’ by Tim Clarkson.
To understand the context of this post please read The Danelaw in Derbyshire. This summarises the evidence for the Danelaw boundary in this area. Place name evidence suggests that south Derbyshire was part of the Danelaw and controlled by the Vikings but Staffordshire and north-west Derbyshire remained Anglo-Saxon. The River Dove was the Danelaw boundary up to the Henmore brook but the boundary then followed the Henmore from west to east,
The traditional game of Shrovetide football is played in Ashbourne every Shrove Tuesday and Ash Wednesday. There are two sides, uppards and downards; uppards are those born on the north side of the Henmore Brook and downards those born on the south side. The goals are about three miles apart at the mills of Clifton and Sturston, Clifton is downstream from Ashbourne and Sturston upstream. The number of players on each side is unlimited and the objective is to carry the ball to the opposing mill and bang the ball three times against the mill wheel. Play starts at 2pm each day and finishes at 10pm.
The division of the sides into uppards and downards clearly mirrors the division of Ashbourne in the Danelaw period. The uppards are the Anglo-Saxons and the downards are the Vikings. The aim of the uppards (Anglo-Saxons) is to score at Sturston mill. The placename Sturston is believed to be a hybrid name – a Viking personal name + tun which is Old English for settlement. So the Anglo-Saxons are attemting to score at the Viking mill. The downards (Vikings) are attempting to score at the Clifton mill which has a placename that is purely Anglo-Saxon.
The earliest reference to Shrovetide football at Ashbourne is from the 17th century but ball games have mentioned earlier in the historical record and it is possible that the game at Ashbourne is based upon rivalries that have existed since the 9th or 10th centuries.
Footnote:
Atherstone (Warwickshire) has a similar game played on Shrove Tuesday. The game there starts at 3pm and lasts until 5pm and the person who has the ball at 5pm is the winner. Originally the game was a contest between the Atherstone inhabitants of Warwickshire and those of Leicestershire. Atherstone sits on Watling Street which, according to the Anglo-Saxon chronicle, was the border of the Danelaw. The contest dates back to at least 1200 and like Ashbourne Shrovetide the Atherstone game looks as if it had its origins in the rivalry between Vikings and Anglo-Saxons with the Vikings of Leicestershire taking in the Anglo-Saxons of Warwickshire. So it looks as if Vikings and Anglo-Saxons settled their differences with a game of football rather than swords and shields.
I have attempted to read the paper ‘Population genomics of the Viking world’ recently published in ‘Nature’ and found it totally incomprehensible. To understand it you need a degree in statistics and/or genetics. This is dangerous because non specialists are not able to critically assess the work to ensure that the conclusions are justified by the evidence. They can only understand the Abstract and Discussion and hope that the authors’ preconceptions and errors have not affected the conclusions.
It then becomes a matter of faith, you either believe it or you don’t. There are errors in the work, eg: “The ancient samples are divided into the following five broad categories: Bronze Age (BA), Iron Age (IA), Early Viking Age (EVA), Viking Age (VA), Medieval (MED) and Early Modern (EM).” They can’t count! How can they expect us to believe that the complex statistics are right when they can’t count beyond five? There are 89 authors listed; did any of them read it? Apparently not.